
LES Breathe Sensors 24/7 for all to see
We have great news to report for our neighborhood. We now have three air monitoring sensors placed in the East Village and the Lower East Side. These fill a vital information gap with real-time sensors that are working 24/7 to gather baseline data and to focus attention on the impact of the East Side Coastal Resiliency construction on our already compromised air quality, temperature and public health.
Our monitors
We researched low-cost high quality sensors and chose PurpleAir for fixed outdoor locations and Atmotube for indoors and mobile air quality sensors.
Here’s how they work. On the interactive map below, you can see the location of our first three neighborhood air quality sensors. Adjust your map view to the Lower East Side, or view fullscreen. When the map opens, it includes 2 pop-ups you can close (a Purple Air sensors ad and the website cookie policy). Purple Air Lower East Side.
Each numbered circle is a sensor, color coded to match the current reading – green is the best, yellow is fair, and deep red the worst. Sensors with a black ring are indoor sensors.
The map defaults to the real-time US EPA PM 2.5 AQI reading. Click a circle and two information windows will pop up.

The color-coded vertical window (also seen in real time on the sidebar) details the current reading along with an explanation and advice. In the lower section, it provides the sensor’s name (LESBreathe1, 2 and 3), wifi strength and confidence in the sensor’s data.
The second pop-up window provides a graph of the recent air quality data for the two laser counters in each sensor. This also defaults to the real-time US EPA PM 2.5 AQI reading.

You can add data from additional sensors by clicking their circle on the map. The image below shows a graph with data from all three of the LES Breathe sensors.

Below the graph is a list of the different sensors shown in the graph. Hover over each of the names to see that sensor data highlighted against the data from the other sensors. The image below highlights the sensor LESBreathe3 B against the data from the other sensors. You can see exactly when air quality spiked!

Click on the “hamburger” icon (3 horizontal lines) in the upper right of the window to see options to download the graph.
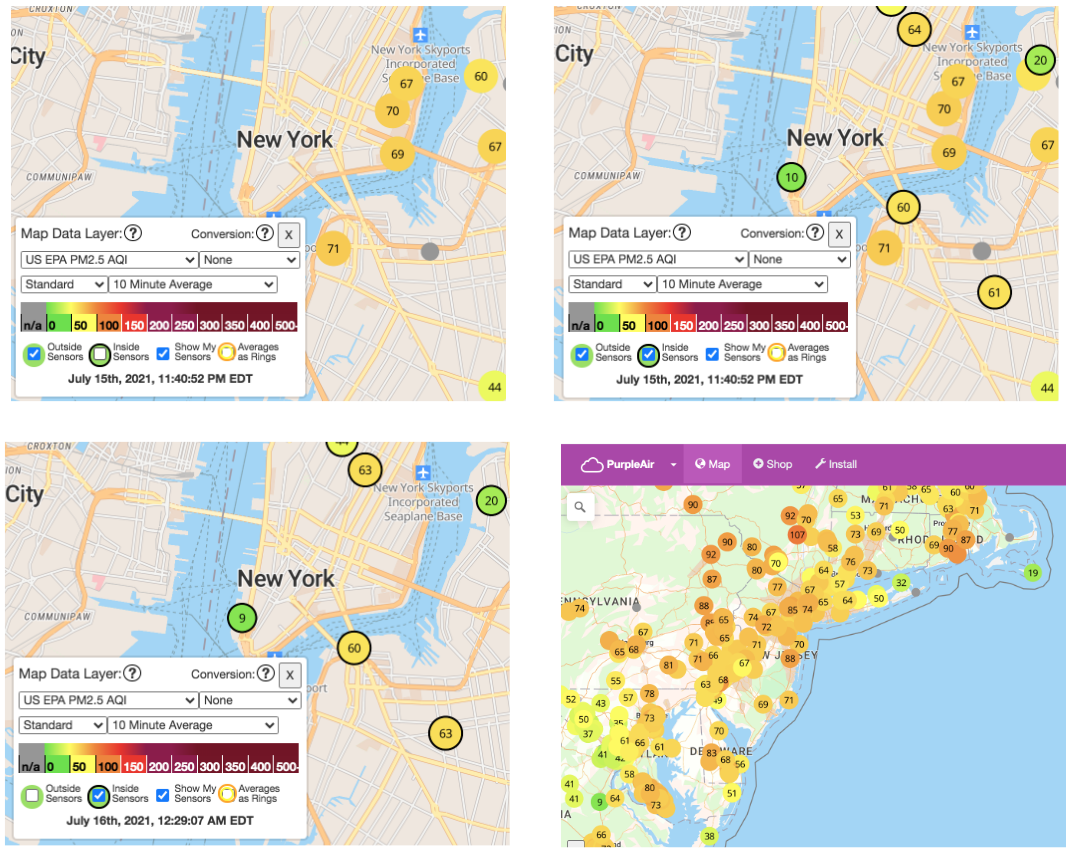
Next, click on the X in the upper right hand corner of the graph window, then click the white bar containing the words US EPA PM 2.5 AQI. The window will now show options available to view different data readings.

You can change the data being shown for temperature, humidity, raw PMs, conversion factor, etc. You can also show just the outside sensors by un-checking the interior sensor option. The map will refresh after each change. (Note: some of the data points shown are not supported on the map and the circles will turn gray.) Hover your cursor over the i to reveal the information about the different data options.
If you want to see the sensor data over a longer period of time than real-time, change the averaging period. Now, when you click on a sensor circle, the graph will show a longer time period of data (two images compare options).


Here are the Map Data Layers you can work with to get detailed information in various ways. Note that Purpleair adjusts the interface occasionally. These screenshots are from a previous version, but show all the same options.
Show everyone
PurpleAir readings can be viewed on the desktop or mobile. You can point your phone’s camera at the QR code to see our neighborhood (or type in bit.ly/pa-les (a shortcut to the PurpleAir map)). See this data on Weather Underground, Open AQ and other air quality data maps.

Want to add this color-coded block to your website? “Get this Widget” provides the code to add an always current block to your webpage, Json and other data downloads. (For questions, see the FAQ). Here is the code to add this map to your website:
<iframe title=”Monitoring East River Park – NYC” src=”https://www.purpleair.com/map?opt=1/mAQI/a0/cC0&key=R2V0N18C887K0FT2#13/40.71238/-73.9805″ width=”100%” height=”500″ frameborder=”0″ allowfullscreen=”true”> </iframe>
What we can learn
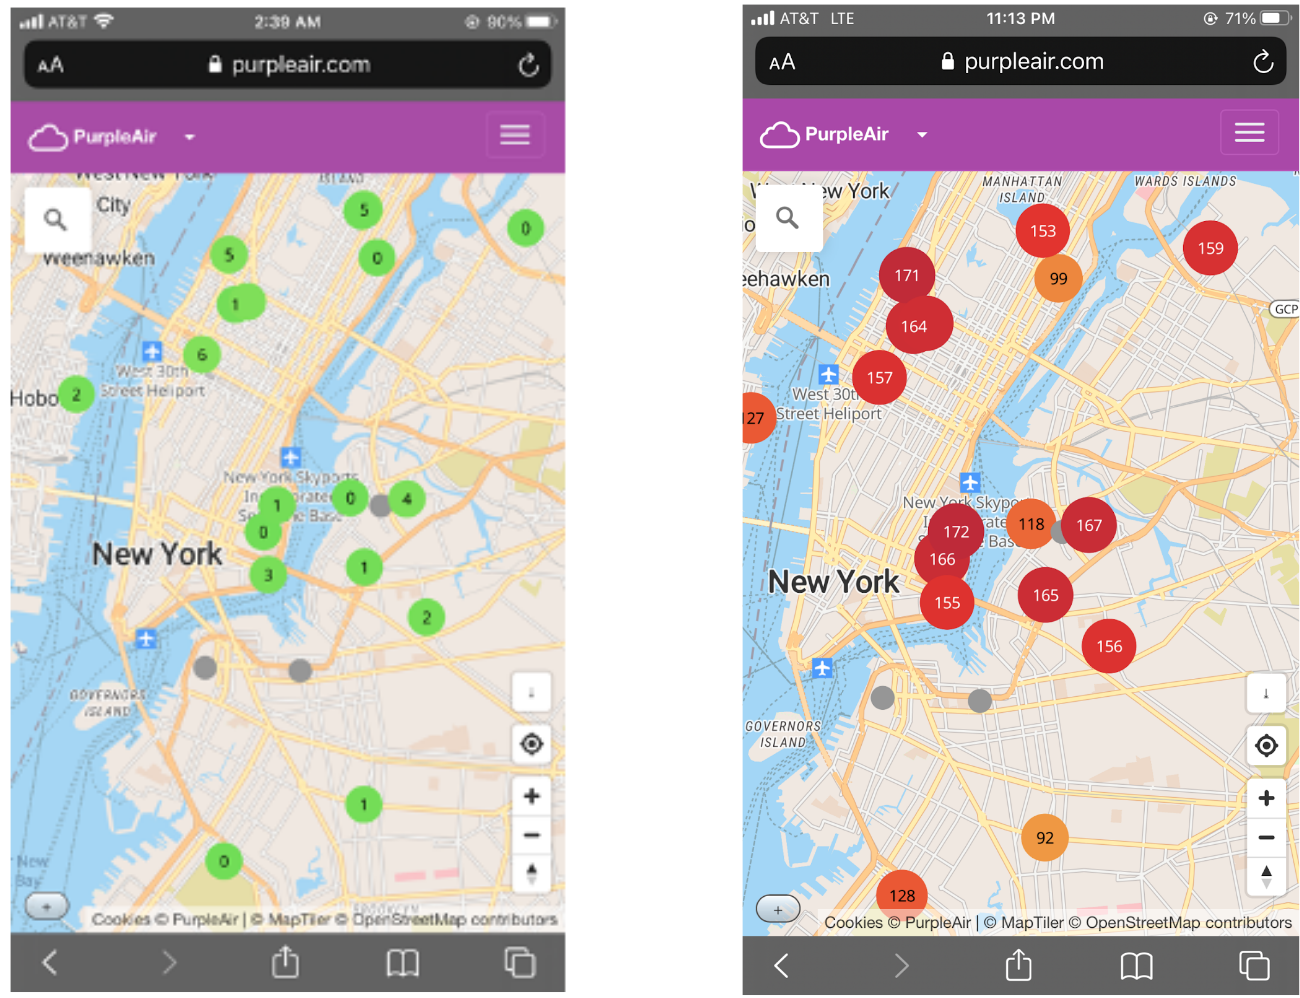
Look at examples. On the left is a screenshot of the PurpleAir Map made on 03 July 2021 after a rainstorm, showing very clean air. The screenshot on the right shows readings one day later. You can see how the fireworks by East River Park worsened air quality at 11:13 pm on the night of 04 July 2021.
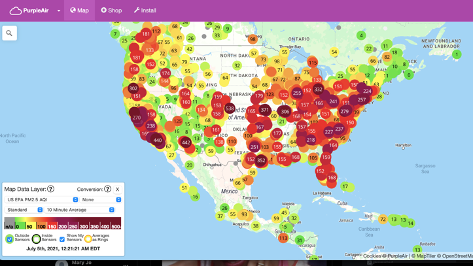
You can zoom out to see the whole region, country or world. Check out the map of the continental United States, taken just after the fireworks. The prevailing winds generally blow west to east, so NYC can be impacted by distant pollution.
Use these types of data to create your own visualizations (technical questions? The FAQ will help). Tag your work #LESBreathe @ERPAction or send a link to lesbreathe@gmail.com and we’ll share it.
Indoors and on the Go
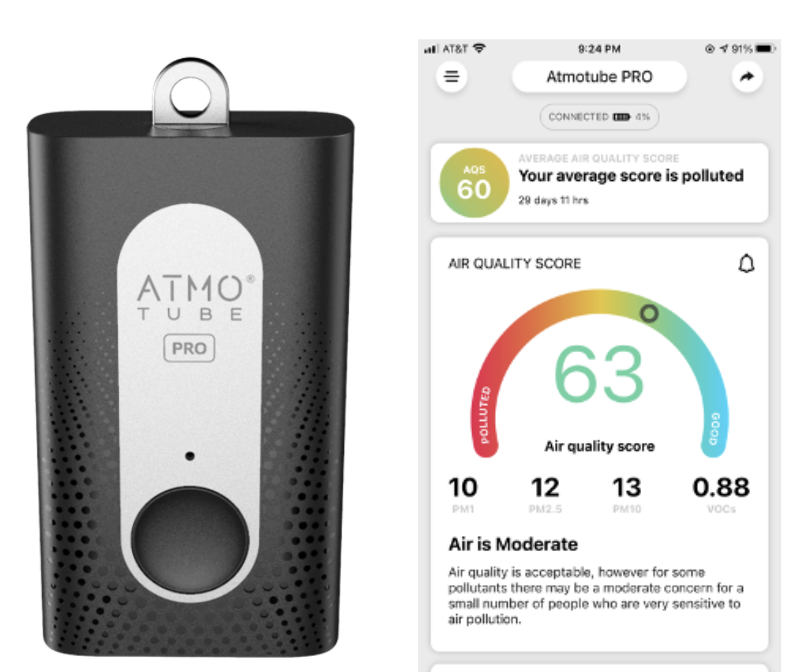
LES Breathe also purchased Atmotube portable air quality sensors that can be used indoors at home and around the neighborhood. Although we know indoor air quality can be much worse than outdoors, we have been a bit surprised at some of the poor readings in our own apartments and offices!
This monitor can also measure your daily commute, for instance. Unlike PurpleAir, the higher the number on Atmotube’s app, the better the air quality. 100 is the best. The row of smaller numbers break out the readings into different size particles (measured per cubic micron) PM1, PM2.5, PM10 and VOCs (Volatile Organic Compounds) that harm health.
You can clip one on your belt or bike and the data can be used in various applications, such as this visualization by Kate Nicholson of Beta NYC on her commute from Greenpoint to the Civic Center.
The Atmotube website explains how the VOC sensor works, with video. The device has a color-coded light for a quick reference. The app includes details on the readings, and will alert you to very polluted air.
We are planning to use the Atmotubes for walk-abouts, bike rides and subway rides to measure air quality during different modes of travel in the city. You may be able to borrow a sensor.
What the City is doing
The City promised to install air quality monitors to measure particulate matter from construction of the East Side Coastal Resiliency project. If construction exceeds certain limits, there should be remedies.
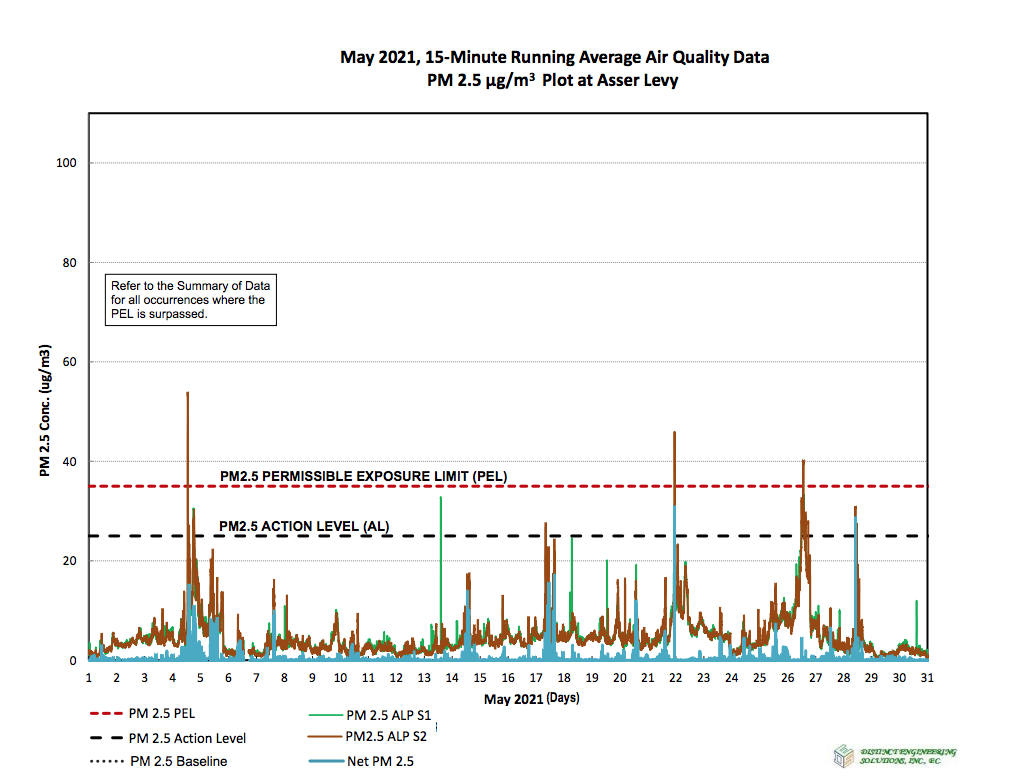
Recently, months after beginning construction, they released the first ESCR Quarterly Air Quality Monitoring Report on the contractor’s air, temperature, noise and vibration sensors installed around 23rd Street where ESCR’s Project Area 2 is under construction. See the ESCR CAG updates here, and you can review the first quarterly AQ report here.
This Report is not real time data, but it does show there is an increase in PM2.5 over the baseline, and when thresholds were exceeded. The city did not act to mitigate air quality. In fact, when the monitors exceeded acceptable levels near a bus stop with idling buses, they just moved the sensors away from that corner. The people at the bus stop were still breathing unacceptable levels of particulate matter, but that combination of construction and emissions were acceptable somehow. See the ESCR Quarterly Air Quality Monitoring Report graph below for information on what our neighbors were breathing. Cough cough.
Can our people’s air monitoring do a better job of engaging attention and holding the city and contractors accountable?
Meantime, we are requesting that the weekly ESCR emails (subscribe here) include a reminder to close windows during work hours to reduce impacts at home. We’re also sharing tips for cleaner air at home (in English and Spanish). Have ideas and visualizations to share? Tag them @LESBreathe.
You made it happen
Our thanks to the many donors who contributed more than $1,200 to purchase all these modestly priced open source sensors. You are helping to fill a vital information gap with real-time sensors that are working 24/7 to gather baseline data and to focus attention on the impacts of the ESCR on air quality, temperature and public health.
Please donate to further this work, scientifically gathering more evidence that forcefully shows our elected officials the urgent need for measures to improve our air quality.